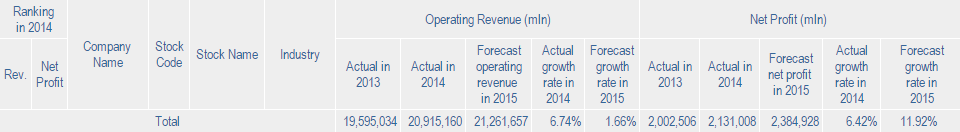
2015 Performance Forecast of Top10 Listed Companies among CSI300
Unit: mln yuan
| No. |
Stock Code |
Stock Name |
Industry |
Operating Revenue |
Net Profit |
| 2013 |
2014 |
Forecast in 2015 |
Actual growth rate in 2014 |
Forecasted growth rate in 2015 |
2013 |
2014 |
Forecast in 2015 |
Actual growth rate in 2014 |
Forecasted growth rate in 2015 |
| 1 |
600028 |
Sinopec Corp. |
Oil |
2,880,311 |
2,825,914 |
2,402,027 |
-1.89% |
-15.00% |
67,179 |
47,430 |
40,367 |
-29.40% |
-14.89% |
| 2 |
601857 |
PetroChina |
Oil |
2,258,124 |
2,282,962 |
1,940,518 |
1.10% |
-15.00% |
129,577 |
107,173 |
87,903 |
-17.29% |
-17.98% |
| 3 |
601668 |
CSCEC |
Construction & Construction Materials |
681,048 |
800,029 |
840,510 |
17.47% |
5.06% |
20,399 |
22,570 |
24,294 |
10.65% |
7.64% |
| 4 |
601398 |
ICBC |
Banking |
589,637 |
658,892 |
676,853 |
11.75% |
2.73% |
262,649 |
275,811 |
281,993 |
5.01% |
2.24% |
| 5 |
600104 |
SAIC Motor |
Automobiles |
565,807 |
630,001 |
649,027 |
11.35% |
3.02% |
24,804 |
27,973 |
31,601 |
12.78% |
12.97% |
| 6 |
601390 |
China Railway |
Construction & Construction Materials |
560,444 |
612,559 |
643,555 |
9.30% |
5.06% |
9,375 |
10,360 |
10,821 |
10.51% |
4.45% |
| 7 |
601186 |
CRCC |
Construction & Construction Materials |
586,790 |
591,968 |
609,846 |
0.88% |
3.02% |
10,345 |
11,343 |
12,255 |
9.65% |
8.03% |
| 8 |
601939 |
CCB |
Banking |
508,608 |
570,470 |
588,618 |
12.16% |
3.18% |
214,657 |
227,830 |
230,412 |
6.14% |
1.13% |
| 9 |
601288 |
Agricultural Bank of China |
Banking |
462,625 |
520,858 |
567,180 |
12.59% |
8.89% |
166,315 |
179,461 |
183,792 |
7.90% |
2.41% |
| 10 |
601318 |
Ping An of China |
Insurance |
362,631 |
462,882 |
553,929 |
27.65% |
19.67% |
28,154 |
39,279 |
46,372 |
39.51% |
18.06% |
| Total |
9,456,025 |
9,956,536 |
9,472,064 |
5.29% |
-4.87% |
933,452 |
949,231 |
949,809 |
1.69% |
0.06% |
2015 Performance Forecast of Top10 Profitable Listed Companies among CSI300
Unit: mln yuan
| No. |
Stock Code |
Company Name |
Industry |
Operating revenue |
Net Profit |
| 2013 |
2014 |
Forecast in 2015 |
Actual growth rate in 2014 |
Forecasted growth rate in 2015 |
2013 |
2014 |
Forecast in 2015 |
Actual growth rate in 2014 |
Forecasted growth rate in 2015 |
| 1 |
601398 |
ICBC |
Banking |
589,637 |
658,892 |
676,853 |
11.75% |
2.73% |
262,649 |
275,811 |
281,993 |
5.01% |
2.24% |
| 2 |
601939 |
CCB |
Banking |
508,608 |
570,470 |
588,618 |
12.16% |
3.18% |
214,657 |
227,830 |
230,412 |
6.14% |
1.13% |
| 3 |
601288 |
Agricultural Bank of China |
Banking |
462,625 |
520,858 |
567,180 |
12.59% |
8.89% |
166,315 |
179,461 |
183,792 |
7.90% |
2.41% |
| 4 |
601988 |
Bank of China |
Banking |
407,508 |
456,331 |
477,362 |
11.98% |
4.61% |
156,911 |
169,595 |
178,860 |
8.08% |
5.46% |
| 5 |
601857 |
PetroChina |
Oil |
2,258,124 |
2,282,962 |
1,940,518 |
1.10% |
-15.00% |
129,577 |
107,173 |
87,903 |
-17.29% |
-17.98% |
| 6 |
601328 |
BANKCOMM |
Banking |
164,435 |
177,401 |
184,297 |
7.89% |
3.89% |
62,295 |
65,850 |
67,512 |
5.71% |
2.52% |
| 7 |
600036 |
CMB |
Banking |
132,604 |
165,863 |
188,666 |
25.08% |
13.75% |
51,743 |
55,911 |
60,691 |
8.06% |
8.55% |
| 8 |
600028 |
Sinopec Corp. |
Oil |
2,880,311 |
2,825,914 |
2,402,027 |
-1.89% |
-15.00% |
67,179 |
47,430 |
40,367 |
-29.40% |
-14.89% |
| 9 |
601166 |
Industrial Bank |
Banking |
109,287 |
124,898 |
138,609 |
14.28% |
10.98% |
41,211 |
47,138 |
50,309 |
14.38% |
6.73% |
| 10 |
600000 |
SPD Bank |
Banking |
100,015 |
123,181 |
133,876 |
23.16% |
8.68% |
40,922 |
47,026 |
51,158 |
14.92% |
8.79% |
| Total |
7,613,154 |
7,906,770 |
7,298,006 |
3.86% |
-7.70% |
1,193,459 |
1,223,225 |
1,232,997 |
2.49% |
0.80% |
Industrial growth
Note: Click the industry label in the chart for details.

2015 Performance Forecast of CSI300 Listed Companies
Industry:Non-ferrous Metals
Unit: mln yuan
| No. |
Stock Code |
Company Name |
Operating revenue |
Net Profit |
| 2013 |
2014 |
Forecast
in 2015 |
Actual growth rate
in 2014 |
Forecasted growth rate
in 2015 |
2013 |
2014 |
Forecast
in 2015 |
Actual growth rate
in 2014 |
Forecasted growth rate
in 2015 |
| 1 |
600362 |
JCCL |
175,890 |
198,833 |
186,903 |
13.04% |
-6.00% |
3,565 |
2,851 |
2,637 |
-20.04% |
-7.48% |
| 2 |
601600 |
CHALCO |
173,038 |
141,772 |
174,380 |
-18.07% |
23.00% |
948 |
-16,217 |
1,128 |
Turn into loss |
Turn into profit |
| 3 |
000630 |
TLYS |
76,165 |
88,818 |
96,812 |
16.61% |
9.00% |
573 |
301 |
394 |
-47.49% |
31.04% |
| 4 |
000878 |
YCC |
50,100 |
62,404 |
64,277 |
24.56% |
3.00% |
-1,496 |
73 |
76 |
Stop loss |
4.26% |
| 5 |
601899 |
Zijin Mining |
49,772 |
58,761 |
70,513 |
18.06% |
20.00% |
2,125 |
2,345 |
2,037 |
10.34% |
-13.12% |
| 6 |
600547 |
sd-gold |
46,168 |
45,794 |
41,215 |
-0.81% |
-10.00% |
1,127 |
832 |
680 |
-26.19% |
-18.29% |
| 7 |
600489 |
ZHONGJIN GOLD |
30,491 |
33,551 |
32,545 |
10.04% |
-3.00% |
431 |
84 |
45 |
-80.43% |
-46.37% |
| 8 |
000960 |
YTL |
21,922 |
26,134 |
28,747 |
19.21% |
10.00% |
-1,341 |
34 |
-183 |
Turn into profit |
Turn into loss |
| 9 |
000060 |
NONFEMET |
21,162 |
24,609 |
25,839 |
16.29% |
5.00% |
413 |
470 |
530 |
13.80% |
12.66% |
| 10 |
601168 |
Western Mining |
25,272 |
24,247 |
23,520 |
-4.05% |
-3.00% |
350 |
290 |
95 |
-17.07% |
-67.29% |
| 11 |
600497 |
Ch Zn&Ge |
18,078 |
18,898 |
20,787 |
4.54% |
10.00% |
589 |
161 |
151 |
-72.66% |
-6.57% |
| 12 |
600549 |
XTC |
9,875 |
10,143 |
11,157 |
2.71% |
10.00% |
460 |
441 |
251 |
-4.01% |
-43.10% |
| 13 |
601958 |
JDCMOLY |
8,616 |
8,526 |
9,379 |
-1.04% |
10.00% |
178 |
192 |
110 |
7.98% |
-42.64% |
| 14 |
603993 |
CMOC |
5,536 |
6,662 |
9,061 |
20.34% |
36.00% |
1,174 |
1,824 |
2,121 |
55.36% |
16.26% |
| 15 |
600111 |
CNRE |
8,472 |
5,838 |
7,589 |
-31.09% |
30.00% |
1,574 |
643 |
841 |
-59.15% |
30.73% |
| 16 |
000831 |
GLGF |
1,705 |
702 |
3,510 |
-58.84% |
400.00% |
224 |
-56 |
236 |
Turn into loss |
Turn into profit |
| Total |
722,262 |
755,693 |
806,233 |
4.63% |
6.69% |
10,895 |
-5,730 |
11,150 |
Turn into loss |
Turn into profit |
2015 Performance Forecast of CSI300 Listed Companies
Industry:Transportation
Unit: mln yuan
| No. |
Stock Code |
Company Name |
Operating revenue |
Net Profit |
| 2013 |
2014 |
Forecast
in 2015 |
Actual growth rate
in 2014 |
Forecasted growth rate
in 2015 |
2013 |
2014 |
Forecast
in 2015 |
Actual growth rate
in 2014 |
Forecasted growth rate
in 2015 |
| 1 |
601766 |
CRRC |
97,886 |
119,724 |
150,853 |
22.31% |
26.00% |
4,140 |
5,315 |
6,603 |
28.38% |
24.23% |
| 2 |
600029 |
China South Air |
98,130 |
108,313 |
113,729 |
10.38% |
5.00% |
1,895 |
1,773 |
6,346 |
-6.44% |
257.90% |
| 3 |
601111 |
Air China |
97,628 |
104,826 |
110,067 |
7.37% |
5.00% |
3,319 |
3,782 |
7,982 |
13.97% |
111.04% |
| 4 |
600115 |
CEA |
88,009 |
89,746 |
94,233 |
1.97% |
5.00% |
2,376 |
3,417 |
6,024 |
43.81% |
76.31% |
| 5 |
601919 |
ChinaCOSCO |
61,934 |
64,374 |
68,237 |
3.94% |
6.00% |
235 |
363 |
389 |
53.96% |
7.37% |
| 6 |
601006 |
Daqin Railway |
51,343 |
53,971 |
57,749 |
5.12% |
7.00% |
12,692 |
14,185 |
15,210 |
11.77% |
7.22% |
| 7 |
601866 |
CSCL |
34,341 |
36,233 |
38,045 |
5.51% |
5.00% |
-2,646 |
1,061 |
1,534 |
Turn into profit |
44.51% |
| 8 |
600221 |
HNA |
30,231 |
36,044 |
38,206 |
19.23% |
6.00% |
2,105 |
2,591 |
4,003 |
23.09% |
54.47% |
| 9 |
600018 |
SIPG |
28,162 |
28,779 |
30,793 |
2.19% |
7.00% |
5,256 |
6,767 |
7,478 |
28.75% |
10.51% |
| 10 |
600717 |
TIANJIN PORT |
16,626 |
25,528 |
26,294 |
53.54% |
3.00% |
1,067 |
1,152 |
1,295 |
7.91% |
12.46% |
| 11 |
601333 |
GSRC |
15,801 |
14,801 |
15,689 |
-6.33% |
6.00% |
1,274 |
662 |
802 |
-48.03% |
21.14% |
| 12 |
601018 |
NBP |
11,396 |
13,415 |
13,818 |
17.72% |
3.00% |
2,840 |
2,819 |
3,039 |
-0.75% |
7.83% |
| 13 |
601021 |
SA |
6,563 |
7,328 |
8,500 |
11.64% |
16.00% |
732 |
884 |
1,247 |
20.75% |
41.07% |
| 14 |
600009 |
SIA |
5,215 |
5,751 |
6,498 |
10.27% |
13.00% |
1,873 |
2,096 |
2,497 |
11.89% |
19.17% |
| 15 |
600317 |
YKPLC |
3,687 |
3,910 |
3,989 |
6.06% |
2.00% |
511 |
540 |
561 |
5.58% |
4.04% |
| Total |
646,953 |
712,743 |
776,700 |
10.17% |
8.97% |
37,668 |
47,406 |
65,011 |
25.85% |
37.14% |
2015 Performance Forecast of CSI300 Listed Companies
Industry:Real Estate
Unit: mln yuan
| No. |
Stock Code |
Company Name |
Operating revenue |
Net Profit |
| 2013 |
2014 |
Forecast
in 2015 |
Actual growth rate
in 2014 |
Forecasted growth rate
in 2015 |
2013 |
2014 |
Forecast
in 2015 |
Actual growth rate
in 2014 |
Forecasted growth rate
in 2015 |
| 1 |
000002 |
VANKE-A |
135,419 |
146,388 |
188,584 |
8.10% |
28.82% |
15,119 |
15,745 |
19,842 |
4.15% |
26.02% |
| 2 |
600048 |
PRE |
92,356 |
109,056 |
132,787 |
18.08% |
21.76% |
10,747 |
12,200 |
16,733 |
13.52% |
37.15% |
| 3 |
600383 |
Gemdale |
34,836 |
45,636 |
45,926 |
31.00% |
0.63% |
3,609 |
3,997 |
4,079 |
10.77% |
2.05% |
| 4 |
000024 |
CMPD |
32,568 |
43,385 |
50,451 |
33.21% |
16.29% |
4,202 |
4,264 |
5,621 |
1.46% |
31.83% |
| 5 |
600340 |
CFLD |
21,060 |
26,886 |
34,682 |
27.66% |
29.00% |
2,715 |
3,538 |
4,624 |
30.30% |
30.72% |
| 6 |
002146 |
RiseSun |
19,171 |
23,119 |
27,263 |
20.59% |
17.92% |
2,906 |
3,232 |
3,823 |
11.20% |
18.28% |
| 7 |
000402 |
Financial Street |
19,883 |
22,036 |
22,537 |
10.83% |
2.27% |
2,892 |
2,927 |
3,107 |
1.24% |
6.12% |
| 8 |
600208 |
XINHU ZHONGBAO |
9,209 |
11,038 |
14,369 |
19.86% |
30.17% |
983 |
1,082 |
1,843 |
10.05% |
70.31% |
| 9 |
000046 |
OCEANWIDE HOLDINGS |
5,938 |
7,616 |
6,520 |
28.27% |
-14.39% |
1,181 |
1,559 |
1,385 |
31.96% |
-11.15% |
| 10 |
600663 |
LJZ |
4,510 |
5,117 |
6,055 |
13.46% |
18.33% |
1,406 |
1,602 |
1,896 |
13.91% |
18.39% |
| 11 |
000009 |
CBG |
4,155 |
4,311 |
4,958 |
3.77% |
15.00% |
292 |
303 |
343 |
3.74% |
13.24% |
| Total |
379,102 |
444,589 |
534,130 |
17.27% |
20.14% |
46,052 |
50,449 |
63,295 |
9.55% |
25.46% |
2015 Performance Forecast of CSI300 Listed Companies
Industry:Banking
Unit: mln yuan
| No. |
Stock Code |
Company Name |
Operating revenue |
Net Profit |
| 2013 |
2014 |
Forecast
in 2015 |
Actual growth rate
in 2014 |
Forecasted growth rate
in 2015 |
2013 |
2014 |
Forecast
in 2015 |
Actual growth rate
in 2014 |
Forecasted growth rate
in 2015 |
| 1 |
601398 |
ICBC |
589,637 |
658,892 |
676,853 |
11.75% |
2.73% |
262,649 |
275,811 |
281,993 |
5.01% |
2.24% |
| 2 |
601939 |
CCB |
508,608 |
570,470 |
588,618 |
12.16% |
3.18% |
214,657 |
227,830 |
230,412 |
6.14% |
1.13% |
| 3 |
601288 |
Agricultural Bank of China |
462,625 |
520,858 |
567,180 |
12.59% |
8.89% |
166,315 |
179,461 |
183,792 |
7.90% |
2.41% |
| 4 |
601988 |
Bank of China |
407,508 |
456,331 |
477,362 |
11.98% |
4.61% |
156,911 |
169,595 |
178,860 |
8.08% |
5.46% |
| 5 |
601328 |
BANKCOMM |
164,435 |
177,401 |
184,297 |
7.89% |
3.89% |
62,295 |
65,850 |
67,512 |
5.71% |
2.52% |
| 6 |
600036 |
CMB |
132,604 |
165,863 |
188,666 |
25.08% |
13.75% |
51,743 |
55,911 |
60,691 |
8.06% |
8.55% |
| 7 |
600016 |
CMBC |
115,886 |
135,469 |
149,135 |
16.90% |
10.09% |
42,278 |
44,546 |
46,592 |
5.36% |
4.59% |
| 8 |
601166 |
Industrial Bank |
109,287 |
124,898 |
138,609 |
14.28% |
10.98% |
41,211 |
47,138 |
50,309 |
14.38% |
6.73% |
| 9 |
601998 |
CNCB |
104,558 |
124,716 |
135,614 |
19.28% |
8.74% |
39,175 |
40,692 |
42,688 |
3.87% |
4.91% |
| 10 |
600000 |
SPD Bank |
100,015 |
123,181 |
133,876 |
23.16% |
8.68% |
40,922 |
47,026 |
51,158 |
14.92% |
8.79% |
| 11 |
601818 |
CEB BANK |
65,306 |
78,531 |
87,717 |
20.25% |
11.70% |
26,715 |
28,883 |
30,300 |
8.12% |
4.91% |
| 12 |
000001 |
PAB |
52,189 |
73,407 |
87,659 |
40.66% |
19.41% |
15,231 |
19,802 |
24,463 |
30.01% |
23.54% |
| 13 |
600015 |
HUAXIA BANK |
45,219 |
54,885 |
60,685 |
21.38% |
10.57% |
15,506 |
17,981 |
19,385 |
15.96% |
7.81% |
| 14 |
601169 |
BOB |
30,665 |
36,878 |
39,414 |
20.26% |
6.88% |
13,459 |
15,623 |
16,562 |
16.08% |
6.01% |
| 15 |
601009 |
NJCB |
10,478 |
15,992 |
19,661 |
52.62% |
22.95% |
4,497 |
5,609 |
6,747 |
24.72% |
20.29% |
| 16 |
002142 |
Bank of Ningbo |
12,761 |
15,357 |
17,411 |
20.34% |
13.37% |
4,847 |
5,627 |
6,503 |
16.10% |
15.56% |
| Total |
2,911,782 |
3,333,128 |
3,552,756 |
14.47% |
6.59% |
1,158,411 |
1,247,385 |
1,297,967 |
7.68% |
4.06% |
2015 Performance Forecast of CSI300 Listed Companies
Industry:Biopharmaceutical
Unit: mln yuan
| No. |
Stock Code |
Company Name |
Operating revenue |
Net Profit |
| 2013 |
2014 |
Forecast
in 2015 |
Actual growth rate
in 2014 |
Forecasted growth rate
in 2015 |
2013 |
2014 |
Forecast
in 2015 |
Actual growth rate
in 2014 |
Forecasted growth rate
in 2015 |
| 1 |
601607 |
Shanghai Pharma |
78,223 |
92,399 |
94,247 |
18.12% |
2.00% |
2,243 |
2,591 |
2,971 |
15.52% |
14.65% |
| 2 |
600998 |
Jointown |
33,438 |
41,068 |
43,146 |
22.82% |
5.06% |
478 |
561 |
723 |
17.32% |
28.86% |
| 3 |
000963 |
Huadong Medicine |
16,718 |
18,947 |
21,839 |
13.34% |
15.26% |
575 |
757 |
1,117 |
31.60% |
47.65% |
| 4 |
000538 |
Yunnan Baiyao |
15,815 |
18,814 |
21,110 |
18.97% |
12.20% |
2,321 |
2,506 |
2,698 |
7.95% |
7.65% |
| 5 |
600332 |
GYBYS |
17,608 |
18,800 |
19,176 |
6.77% |
2.00% |
980 |
1,192 |
1,541 |
21.68% |
29.22% |
| 6 |
600518 |
KMYY |
13,359 |
15,949 |
17,570 |
19.39% |
10.16% |
1,880 |
2,286 |
2,783 |
21.60% |
21.75% |
| 7 |
600535 |
Tasly |
11,108 |
12,578 |
12,829 |
13.23% |
2.00% |
1,100 |
1,368 |
1,598 |
24.36% |
16.76% |
| 8 |
600196 |
Fosun Pharma |
9,996 |
12,026 |
12,266 |
20.30% |
2.00% |
2,027 |
2,113 |
2,198 |
4.23% |
4.03% |
| 9 |
600085 |
TRT |
8,715 |
9,686 |
10,275 |
11.14% |
6.08% |
656 |
764 |
837 |
16.41% |
9.59% |
| 10 |
002422 |
KELUN PHARMA |
6,831 |
8,023 |
7,775 |
17.45% |
-3.10% |
1,080 |
1,002 |
978 |
-7.19% |
-2.35% |
| 11 |
600276 |
HR |
6,203 |
7,452 |
8,209 |
20.14% |
10.16% |
1,238 |
1,516 |
1,631 |
22.41% |
7.61% |
| 12 |
000999 |
CR SANJIU |
7,802 |
7,277 |
7,125 |
-6.73% |
-2.08% |
1,181 |
1,036 |
1,177 |
-12.29% |
13.59% |
| 13 |
002001 |
NHU |
4,238 |
4,164 |
4,120 |
-1.73% |
-1.06% |
882 |
808 |
789 |
-8.40% |
-2.34% |
| 14 |
000423 |
DEEJ |
4,016 |
4,009 |
5,316 |
-0.18% |
32.60% |
1,203 |
1,366 |
1,595 |
13.52% |
16.80% |
| 15 |
600252 |
Zhongheng Group |
3,997 |
3,214 |
3,377 |
-19.57% |
5.06% |
743 |
1,595 |
1,662 |
114.75% |
4.21% |
| 16 |
002294 |
SALUBRIS |
2,327 |
2,883 |
3,176 |
23.85% |
10.16% |
830 |
1,042 |
1,102 |
25.51% |
5.74% |
| 17 |
000623 |
JLAD |
1,957 |
2,240 |
2,308 |
14.47% |
3.02% |
1,059 |
1,411 |
1,775 |
33.24% |
25.82% |
| 18 |
002399 |
HEPALINK |
1,513 |
1,959 |
1,698 |
29.45% |
-13.30% |
317 |
338 |
328 |
6.60% |
-2.96% |
| 19 |
600867 |
THDB |
1,204 |
1,451 |
1,525 |
20.52% |
5.08% |
184 |
280 |
473 |
52.13% |
69.06% |
| 20 |
002252 |
SHANGHAI RAAS |
496 |
1,320 |
1,642 |
165.88% |
24.44% |
144 |
511 |
758 |
255.27% |
48.37% |
| 21 |
002007 |
HUALAN BIO. |
1,118 |
1,243 |
1,319 |
11.26% |
6.08% |
475 |
538 |
610 |
13.27% |
13.32% |
| 22 |
002038 |
SL PHARM |
1,162 |
1,243 |
1,192 |
6.99% |
-4.12% |
577 |
695 |
730 |
20.38% |
4.96% |
| 23 |
002653 |
HAISCO PHARMA |
992 |
1,211 |
1,272 |
21.99% |
5.06% |
519 |
451 |
466 |
-13.23% |
3.48% |
| Total |
248,836 |
287,957 |
302,511 |
15.72% |
5.05% |
22,693 |
26,725 |
30,538 |
17.77% |
14.27% |
2015 Performance Forecast of CSI300 Listed Companies
Industry:Iron & Steel
Unit: mln yuan
| No. |
Stock Code |
Company Name |
Operating revenue |
Net Profit |
| 2013 |
2014 |
Forecast
in 2015 |
Actual growth rate
in 2014 |
Forecasted growth rate
in 2015 |
2013 |
2014 |
Forecast
in 2015 |
Actual growth rate
in 2014 |
Forecasted growth rate
in 2015 |
| 1 |
600019 |
Baosteel |
190,026 |
187,789 |
193,423 |
-1.18% |
3.00% |
5,818 |
5,792 |
5,787 |
-0.45% |
-0.09% |
| 2 |
600005 |
WISCO, Ltd. |
89,581 |
99,373 |
84,129 |
10.93% |
-15.34% |
427 |
1,257 |
1,483 |
194.32% |
17.94% |
| 3 |
000709 |
Hebei Steel Corp. |
110,255 |
98,257 |
103,170 |
-10.88% |
5.00% |
116 |
697 |
793 |
500.10% |
13.75% |
| 4 |
000825 |
STSS |
105,020 |
86,766 |
81,560 |
-17.38% |
-6.00% |
630 |
442 |
315 |
-29.82% |
-28.76% |
| 5 |
000898 |
ANSC |
75,329 |
74,046 |
75,527 |
-1.70% |
2.00% |
770 |
928 |
944 |
20.52% |
1.70% |
| 6 |
000778 |
XINXING PIPES |
63,014 |
60,793 |
54,714 |
-3.52% |
-10.00% |
1,031 |
835 |
741 |
-19.01% |
-11.28% |
| 7 |
600010 |
BSU |
37,770 |
29,792 |
31,281 |
-21.12% |
5.00% |
251 |
200 |
311 |
-20.09% |
55.25% |
| 8 |
000629 |
PGVT |
15,602 |
16,779 |
15,773 |
7.55% |
-6.00% |
549 |
-3,775 |
-3,373 |
Continue to
lose |
Continue to
lose |
| 9 |
601969 |
Hainan Mining |
2,921 |
1,768 |
1,503 |
-39.47% |
-15.00% |
1,004 |
424 |
330 |
-57.76% |
-22.18% |
| Total |
689,519 |
655,364 |
641,081 |
-4.95% |
-2.18% |
10,597 |
6,801 |
7,331 |
-35.82% |
7.79% |
2015 Performance Forecast of CSI300 Listed Companies
Industry:Coal
Unit: mln yuan
| No. |
Stock Code |
Company Name |
Operating revenue |
Net Profit |
| 2013 |
2014 |
Forecast
in 2015 |
Actual growth rate
in 2014 |
Forecasted growth rate
in 2015 |
2013 |
2014 |
Forecast
in 2015 |
Actual growth rate
in 2014 |
Forecasted growth rate
in 2015 |
| 1 |
601088 |
China Shenhua |
283,797 |
248,360 |
235,594 |
-12.49% |
-5.14% |
45,678 |
36,807 |
32,448 |
-19.42% |
-11.84% |
| 2 |
601898 |
China Coal Energy |
82,316 |
70,664 |
59,824 |
-14.16% |
-15.34% |
3,576 |
767 |
361 |
-78.56% |
-52.91% |
| 3 |
600188 |
YANZHOUCOAL |
58,727 |
63,923 |
57,377 |
8.85% |
-10.24% |
1,271 |
2,284 |
1,075 |
79.68% |
-52.95% |
| 4 |
601225 |
SHCI |
43,219 |
41,150 |
38,615 |
-4.79% |
-6.16% |
3,486 |
951 |
425 |
-72.71% |
-55.38% |
| 5 |
000983 |
XSCE |
29,500 |
24,391 |
19,903 |
-17.32% |
-18.40% |
1,056 |
273 |
129 |
-74.13% |
-52.74% |
| 6 |
600348 |
YQMY |
26,169 |
20,723 |
19,023 |
-20.81% |
-8.20% |
935 |
792 |
752 |
-15.34% |
-4.98% |
| 7 |
000937 |
JZEG |
25,834 |
18,257 |
10,801 |
-29.33% |
-40.84% |
1,184 |
24 |
-92 |
-97.94% |
Continue to
lose |
| 8 |
601699 |
Lu'an EED |
19,200 |
16,030 |
15,043 |
-16.51% |
-6.16% |
1,529 |
982 |
708 |
-35.77% |
-27.86% |
| 9 |
600157 |
WTECL |
9,843 |
7,912 |
8,474 |
-19.62% |
7.10% |
476 |
405 |
818 |
-14.95% |
101.85% |
| Total |
578,605 |
511,410 |
464,655 |
-11.61% |
-9.14% |
59,192 |
43,286 |
36,624 |
-26.87% |
-15.39% |
2015 Performance Forecast of CSI300 Listed Companies
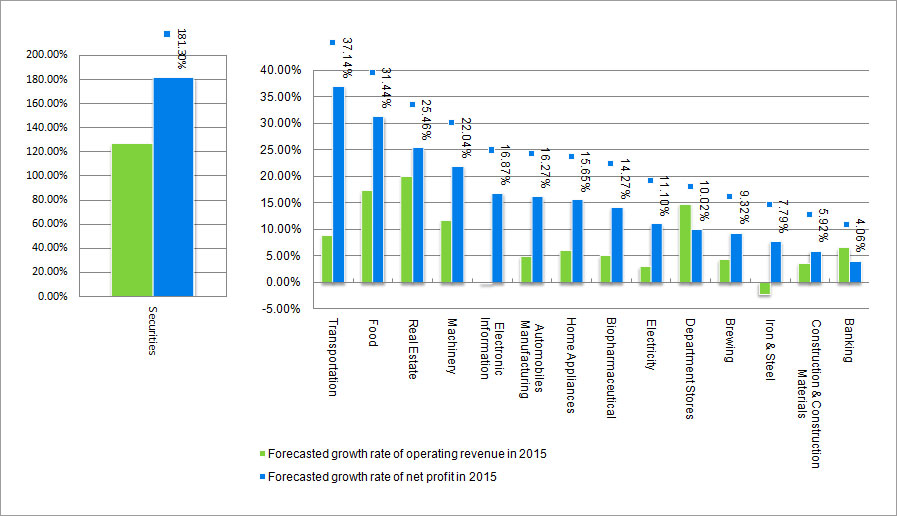
Industry:Securities
Unit: mln yuan
| No. |
Stock Code |
Company Name |
Operating revenue |
Net Profit |
| 2013 |
2014 |
Forecast
in 2015 |
Actual growth rate
in 2014 |
Forecasted growth rate
in 2015 |
2013 |
2014 |
Forecast
in 2015 |
Actual growth rate
in 2014 |
Forecasted growth rate
in 2015 |
| 1 |
600030 |
CITIC Securities Co., Ltd. |
16,115 |
29,198 |
46,075 |
81.18% |
57.80% |
5,244 |
11,337 |
23,441 |
116.20% |
106.76% |
| 2 |
600837 |
HAITONG Securities Co., Ltd. |
10,455 |
17,978 |
30,685 |
71.96% |
70.68% |
4,035 |
7,711 |
19,123 |
91.09% |
148.01% |
| 3 |
000776 |
GF SECURITIES |
8,208 |
13,395 |
22,956 |
63.20% |
71.38% |
2,813 |
5,023 |
14,040 |
78.58% |
179.54% |
| 4 |
601688 |
HTSC |
7,167 |
12,062 |
22,819 |
68.31% |
89.18% |
2,212 |
4,486 |
12,249 |
102.84% |
173.03% |
| 5 |
002736 |
GUOSEN SECURITIES |
6,776 |
11,792 |
38,863 |
74.03% |
229.56% |
2,108 |
4,928 |
17,024 |
133.75% |
245.49% |
| 6 |
600999 |
CMS |
6,087 |
11,002 |
23,085 |
80.77% |
109.82% |
2,230 |
3,851 |
12,864 |
72.70% |
234.07% |
| 7 |
000166 |
Shenwan Hongyuan |
10,066 |
8,657 |
26,782 |
-14.00% |
209.38% |
3,105 |
3,428 |
13,005 |
10.41% |
279.41% |
| 8 |
601788 |
EBSCN |
4,020 |
6,601 |
22,227 |
64.23% |
236.70% |
206 |
2,068 |
5,706 |
905.12% |
175.88% |
| 9 |
601377 |
IS |
3,104 |
5,609 |
16,790 |
80.73% |
199.34% |
673 |
1,782 |
5,854 |
164.75% |
228.58% |
| 10 |
600958 |
ORIENT SECURITIES |
3,244 |
5,500 |
15,791 |
69.53% |
187.14% |
1,007 |
2,342 |
7,699 |
132.44% |
228.79% |
| 11 |
601901 |
Founder Securities |
3,442 |
4,900 |
13,819 |
42.37% |
182.04% |
1,106 |
1,796 |
4,425 |
62.45% |
146.37% |
| 12 |
000783 |
Changjiang Securities |
3,048 |
4,548 |
11,684 |
49.22% |
156.89% |
1,006 |
1,705 |
5,094 |
69.55% |
198.69% |
| 13 |
600369 |
SWSC |
1,964 |
3,675 |
13,762 |
87.10% |
274.49% |
630 |
1,339 |
3,812 |
112.44% |
184.68% |
| 14 |
000728 |
GUOYUAN SECURITIES |
1,985 |
3,486 |
6,722 |
75.63% |
92.83% |
664 |
1,372 |
3,310 |
106.55% |
141.30% |
| 15 |
601555 |
SCS |
1,599 |
3,241 |
8,844 |
102.73% |
172.88% |
383 |
1,115 |
3,538 |
191.52% |
217.18% |
| 16 |
000686 |
NORTHEAST SECURITIES |
1,767 |
3,091 |
6,162 |
74.92% |
99.34% |
480 |
1,060 |
2,886 |
120.81% |
172.26% |
| 17 |
600109 |
SINOLINK SECURITIES |
1,547 |
2,722 |
6,239 |
75.93% |
129.22% |
317 |
836 |
1,932 |
163.95% |
130.97% |
| 18 |
000750 |
SEALAND SECURITIES |
1,819 |
2,545 |
4,160 |
39.93% |
63.46% |
309 |
690 |
2,114 |
123.50% |
206.36% |
| 19 |
002500 |
SHANXI SECURITIES |
1,316 |
1,959 |
4,049 |
48.87% |
106.67% |
259 |
586 |
2,062 |
126.74% |
251.70% |
| 20 |
002673 |
WESTERN SECURITIES |
1,129 |
1,938 |
5,841 |
71.75% |
201.32% |
274 |
664 |
3,076 |
142.37% |
363.35% |
| 21 |
601099 |
PACIFIC SECURITIES |
486 |
1,359 |
4,467 |
179.42% |
228.66% |
75 |
543 |
1,763 |
628.31% |
224.49% |
| Total |
95,341 |
155,259 |
351,822 |
62.85% |
126.60% |
29,133 |
58,662 |
165,017 |
101.36% |
181.30% |
2015 Performance Forecast of CSI300 Listed Companies
Industry:Construction & Construction Materials
Unit: mln yuan
| No. |
Stock Code |
Company Name |
Operating revenue |
Net Profit |
| 2013 |
2014 |
Forecast
in 2015 |
Actual growth rate
in 2014 |
Forecasted growth rate
in 2015 |
2013 |
2014 |
Forecast
in 2015 |
Actual growth rate
in 2014 |
Forecasted growth rate
in 2015 |
| 1 |
601668 |
CSCEC |
681,048 |
800,029 |
840,510 |
17.47% |
5.06% |
20,399 |
22,570 |
24,294 |
10.65% |
7.64% |
| 2 |
601390 |
China Railway |
560,444 |
612,559 |
643,555 |
9.30% |
5.06% |
9,375 |
10,360 |
10,821 |
10.51% |
4.45% |
| 3 |
601186 |
CRCC |
586,790 |
591,968 |
609,846 |
0.88% |
3.02% |
10,345 |
11,343 |
12,255 |
9.65% |
8.03% |
| 4 |
601800 |
CCCC |
332,487 |
366,673 |
374,007 |
10.28% |
2.00% |
12,139 |
13,887 |
14,243 |
14.41% |
2.56% |
| 5 |
601618 |
MCC |
202,690 |
215,786 |
220,101 |
6.46% |
2.00% |
2,981 |
3,965 |
4,875 |
33.01% |
22.95% |
| 6 |
601669 |
POWERCHINA Ltd. |
144,837 |
167,091 |
170,433 |
15.36% |
2.00% |
4,556 |
4,786 |
4,454 |
5.06% |
-6.95% |
| 7 |
600170 |
SCG |
102,036 |
113,662 |
115,935 |
11.39% |
2.00% |
1,618 |
1,772 |
1,828 |
9.50% |
3.17% |
| 8 |
600068 |
CGGC |
59,528 |
71,605 |
76,689 |
20.29% |
7.10% |
1,585 |
2,287 |
2,795 |
44.31% |
22.20% |
| 9 |
601117 |
CNCEC |
61,728 |
69,256 |
70,641 |
12.20% |
2.00% |
3,358 |
3,166 |
3,216 |
-5.73% |
1.58% |
| 10 |
002081 |
Gold Mantis |
18,414 |
20,689 |
21,102 |
12.35% |
2.00% |
1,564 |
1,877 |
2,033 |
20.06% |
8.28% |
| 11 |
002375 |
YASHA |
12,143 |
12,917 |
13,175 |
6.38% |
2.00% |
895 |
1,033 |
1,088 |
15.42% |
5.35% |
| 12 |
002051 |
CAMCE |
9,236 |
9,533 |
7,779 |
3.22% |
-18.40% |
718 |
867 |
721 |
20.64% |
-16.85% |
| 13 |
002310 |
Orient Landscape & Ecology |
4,974 |
4,680 |
3,914 |
-5.91% |
-16.36% |
889 |
648 |
587 |
-27.17% |
-9.32% |
| Total |
2,776,354 |
3,056,447 |
3,167,688 |
10.09% |
3.64% |
70,421 |
78,561 |
83,209 |
11.56% |
5.92% |
2015 Performance Forecast of CSI300 Listed Companies
Industry:Agriculture, Forestry,Animal Husbandry and Fishery
Unit: mln yuan
| No. |
Stock Code |
Company Name |
Operating revenue |
Net Profit |
| 2013 |
2014 |
Forecast
in 2015 |
Actual growth rate
in 2014 |
Forecasted growth rate
in 2015 |
2013 |
2014 |
Forecast
in 2015 |
Actual growth rate
in 2014 |
Forecasted growth rate
in 2015 |
| 1 |
000876 |
NEW HOPE |
69,395 |
70,012 |
64,271 |
0.89% |
-8.20% |
1,899 |
2,020 |
2,263 |
6.39% |
12.04% |
| 2 |
002385 |
DBN Group |
16,661 |
18,445 |
16,180 |
10.71% |
-12.28% |
769 |
796 |
762 |
3.45% |
-4.18% |
| 3 |
600108 |
YASHENG GROUP |
2,337 |
2,245 |
2,015 |
-3.94% |
-10.24% |
380 |
206 |
191 |
-45.82% |
-7.32% |
| 4 |
000061 |
SZAP |
2,182 |
1,648 |
1,631 |
-24.48% |
-1.06% |
111 |
84 |
70 |
-24.18% |
-17.57% |
| Total |
90,576 |
92,350 |
84,097 |
1.96% |
-8.94% |
3,159 |
3,106 |
3,286 |
-1.69% |
5.79% |
2015 Performance Forecast of CSI300 Listed Companies
Industry:Brewing
Unit: mln yuan
| No. |
Stock Code |
Company Name |
Operating revenue |
Net Profit |
| 2013 |
2014 |
Forecast
in 2015 |
Actual growth rate
in 2014 |
Forecasted growth rate
in 2015 |
2013 |
2014 |
Forecast
in 2015 |
Actual growth rate
in 2014 |
Forecasted growth rate
in 2015 |
| 1 |
600519 |
KWEICHOW MOUTAI |
31,071 |
32,217 |
33,847 |
3.69% |
5.06% |
15,137 |
15,350 |
16,509 |
1.41% |
7.55% |
| 2 |
600600 |
TSINGTAO BREWERY |
28,291 |
29,049 |
28,149 |
2.68% |
-3.10% |
1,973 |
1,990 |
2,131 |
0.85% |
7.10% |
| 3 |
000858 |
WLY |
24,719 |
21,011 |
20,789 |
-15.00% |
-1.06% |
7,973 |
5,835 |
6,287 |
-26.81% |
7.75% |
| 4 |
002304 |
Yanghe Brewery |
15,024 |
14,672 |
17,659 |
-2.34% |
20.36% |
5,002 |
4,507 |
4,728 |
-9.89% |
4.90% |
| 5 |
000729 |
Yanjing Brewery |
13,748 |
13,504 |
14,049 |
-1.78% |
4.04% |
681 |
726 |
788 |
6.68% |
8.50% |
| 6 |
000568 |
Lzlj |
10,431 |
5,353 |
6,826 |
-48.68% |
27.50% |
3,438 |
880 |
1,675 |
-74.41% |
90.41% |
| 7 |
600809 |
Shanxi Fen Wine |
6,087 |
3,916 |
3,595 |
-35.67% |
-8.20% |
960 |
356 |
288 |
-62.96% |
-18.97% |
| Total |
129,370 |
119,724 |
124,914 |
-7.46% |
4.34% |
35,164 |
29,644 |
32,407 |
-15.70% |
9.32% |
2015 Performance Forecast of CSI300 Listed Companies
Industry:Automobiles Manufacturing
Unit: mln yuan
| No. |
Stock Code |
Company Name |
Operating revenue |
Net Profit |
| 2013 |
2014 |
Forecast
in 2015 |
Actual growth rate
in 2014 |
Forecasted growth rate
in 2015 |
2013 |
2014 |
Forecast
in 2015 |
Actual growth rate
in 2014 |
Forecasted growth rate
in 2015 |
| 1 |
600104 |
SAIC Motor |
565,807 |
630,001 |
649,027 |
11.35% |
3.02% |
24,804 |
27,973 |
31,601 |
12.78% |
12.97% |
| 2 |
000338 |
Weichai Power |
58,312 |
79,637 |
83,667 |
36.57% |
5.06% |
3,571 |
5,025 |
4,143 |
40.71% |
-17.55% |
| 3 |
600741 |
HASCO |
69,329 |
73,973 |
79,225 |
6.70% |
7.10% |
3,461 |
4,456 |
5,067 |
28.72% |
13.72% |
| 4 |
601633 |
Great Wall Motor |
56,784 |
62,599 |
64,490 |
10.24% |
3.02% |
8,224 |
8,042 |
10,420 |
-2.21% |
29.58% |
| 5 |
601258 |
PD Group |
63,985 |
60,315 |
57,214 |
-5.74% |
-5.14% |
211 |
142 |
128 |
-32.86% |
-9.73% |
| 6 |
002594 |
BYD |
52,863 |
58,196 |
67,077 |
10.09% |
15.26% |
553 |
434 |
932 |
-21.61% |
114.93% |
| 7 |
000625 |
CHANGAN AUTOMOBILE |
38,482 |
52,913 |
76,640 |
37.50% |
44.84% |
3,506 |
7,561 |
10,317 |
115.68% |
36.45% |
| 8 |
000800 |
FAWCAR |
29,675 |
33,857 |
31,081 |
14.09% |
-8.20% |
1,007 |
161 |
222 |
-83.99% |
37.50% |
| 9 |
600166 |
FOTON |
34,153 |
33,691 |
31,616 |
-1.35% |
-6.16% |
763 |
477 |
384 |
-37.47% |
-19.52% |
| 10 |
600066 |
YTCO |
22,094 |
25,728 |
24,931 |
16.45% |
-3.10% |
1,823 |
2,613 |
2,860 |
43.35% |
9.45% |
| 11 |
600660 |
FYG |
11,501 |
12,928 |
13,846 |
12.41% |
7.10% |
1,918 |
2,220 |
2,600 |
15.76% |
17.14% |
| 12 |
000559 |
WXQC |
9,262 |
9,829 |
10,627 |
6.12% |
8.12% |
531 |
707 |
850 |
33.20% |
20.23% |
| 13 |
000581 |
WFHT |
5,589 |
6,354 |
6,806 |
13.69% |
7.10% |
1,108 |
1,539 |
1,809 |
38.91% |
17.54% |
| Total |
1,017,837 |
1,140,022 |
1,196,245 |
12.00% |
4.93% |
51,478 |
61,348 |
71,332 |
19.17% |
16.27% |
2015 Performance Forecast of CSI300 Listed Companies
Industry:Electronic Information
Unit: mln yuan
| No. |
Stock Code |
Company Name |
Operating revenue |
Net Profit |
| 2013 |
2014 |
Forecast
in 2015 |
Actual growth rate
in 2014 |
Forecasted growth rate
in 2015 |
2013 |
2014 |
Forecast
in 2015 |
Actual growth rate
in 2014 |
Forecasted growth rate
in 2015 |
| 1 |
600050 |
China Unicom |
303,727 |
288,571 |
276,682 |
-4.99% |
-4.12% |
3,443 |
3,982 |
4,503 |
15.65% |
13.08% |
| 2 |
000063 |
ZTE |
75,234 |
81,471 |
88,918 |
8.29% |
9.14% |
1,358 |
2,634 |
3,440 |
93.98% |
30.63% |
| 3 |
600100 |
THTF |
22,650 |
25,994 |
27,839 |
14.76% |
7.10% |
677 |
756 |
814 |
11.62% |
7.75% |
| 4 |
600271 |
Aisino Corporation |
16,582 |
19,959 |
20,358 |
20.36% |
2.00% |
1,093 |
1,148 |
1,370 |
5.04% |
19.35% |
| 5 |
600406 |
NARI-TECH |
9,576 |
8,907 |
7,268 |
-6.98% |
-18.40% |
1,600 |
1,283 |
1,073 |
-19.82% |
-16.38% |
| 6 |
600718 |
Neusoft |
7,453 |
7,796 |
7,396 |
4.61% |
-5.14% |
411 |
256 |
282 |
-37.78% |
10.33% |
| 7 |
600804 |
DR.PENG |
5,818 |
6,963 |
7,315 |
19.67% |
5.06% |
403 |
534 |
693 |
32.53% |
29.71% |
| 8 |
300104 |
LETV |
2,361 |
6,819 |
8,346 |
188.79% |
22.40% |
255 |
364 |
845 |
42.75% |
132.12% |
| 9 |
002065 |
DHCC |
4,423 |
5,171 |
5,433 |
16.91% |
5.06% |
771 |
1,039 |
1,126 |
34.74% |
8.43% |
| 10 |
600588 |
Yonyou |
4,363 |
4,374 |
4,462 |
0.26% |
2.00% |
548 |
550 |
634 |
0.43% |
15.19% |
| 11 |
000970 |
Zhong Ke San Huan Co., Ltd. |
3,639 |
3,885 |
3,487 |
6.77% |
-10.24% |
341 |
296 |
239 |
-13.17% |
-19.21% |
| 12 |
600485 |
XINWEI GROUP |
233 |
3,157 |
3,478 |
1255.85% |
10.16% |
15 |
1,812 |
2,151 |
12142.63% |
18.69% |
| 13 |
002465 |
HAIGE COMMUNICATIONS |
1,684 |
2,954 |
3,314 |
75.43% |
12.20% |
326 |
443 |
591 |
35.72% |
33.45% |
| 14 |
300002 |
ULTRAPOWER |
1,906 |
2,549 |
2,418 |
33.69% |
-5.14% |
518 |
624 |
580 |
20.65% |
-7.12% |
| 15 |
002153 |
SHIJI INFORMATION |
1,095 |
2,186 |
1,962 |
99.72% |
-10.24% |
360 |
382 |
322 |
6.23% |
-15.79% |
| 16 |
300017 |
WANGSU |
1,205 |
1,911 |
2,339 |
58.57% |
22.40% |
237 |
484 |
699 |
104.00% |
44.55% |
| 17 |
002230 |
IFLYTEK |
1,254 |
1,775 |
2,173 |
41.60% |
22.40% |
279 |
379 |
391 |
36.00% |
3.10% |
| 18 |
002410 |
GLODON |
1,393 |
1,760 |
1,616 |
26.33% |
-8.20% |
488 |
596 |
629 |
22.06% |
5.44% |
| 19 |
603000 |
People.cn |
1,028 |
1,584 |
1,616 |
54.11% |
2.02% |
273 |
330 |
309 |
21.02% |
-6.43% |
| 20 |
600570 |
HUNDSUN |
1,211 |
1,422 |
1,595 |
17.45% |
12.20% |
323 |
361 |
427 |
11.51% |
18.34% |
| 21 |
300059 |
EASTMONEY |
248 |
612 |
1,467 |
146.31% |
139.70% |
5 |
166 |
423 |
3213.61% |
155.41% |
| 22 |
000503 |
SEARAINBOW |
206 |
195 |
175 |
-5.26% |
-10.24% |
13 |
25 |
14 |
92.46% |
-42.01% |
| Total |
467,288 |
480,015 |
479,656 |
2.72% |
-0.07% |
13,736 |
18,443 |
21,555 |
34.27% |
16.87% |
2015 Performance Forecast of CSI300 Listed Companies
Industry:Machinery
Unit: mln yuan
| No. |
Stock Code |
Company Name |
Operating revenue |
Net Profit |
| 2013 |
2014 |
Forecast
in 2015 |
Actual growth rate
in 2014 |
Forecasted growth rate
in 2015 |
2013 |
2014 |
Forecast
in 2015 |
Actual growth rate
in 2014 |
Forecasted growth rate
in 2015 |
| 1 |
000039 |
CIMC |
57,874 |
70,071 |
86,187 |
21.07% |
23.00% |
2,180 |
2,478 |
3,097 |
13.64% |
24.98% |
| 2 |
600031 |
SANY |
37,328 |
30,365 |
28,239 |
-18.65% |
-7.00% |
2,904 |
709 |
579 |
-75.57% |
-18.33% |
| 3 |
000157 |
Zoomlion |
38,542 |
25,851 |
27,402 |
-32.93% |
6.00% |
3,839 |
594 |
1,057 |
-84.53% |
77.88% |
| 4 |
000425 |
XCMG |
26,995 |
23,306 |
24,472 |
-13.66% |
5.00% |
1,509 |
413 |
641 |
-72.60% |
55.02% |
| 5 |
601106 |
CFHI |
8,369 |
7,328 |
9,087 |
-12.44% |
24.00% |
17 |
26 |
32 |
49.31% |
24.41% |
| 6 |
002353 |
Jereh Group |
3,700 |
4,461 |
4,327 |
20.55% |
-3.00% |
985 |
1,200 |
1,153 |
21.83% |
-3.91% |
| 7 |
300024 |
ROBOT |
1,319 |
1,524 |
2,285 |
15.50% |
50.00% |
250 |
326 |
454 |
30.34% |
39.33% |
| Total |
174,127 |
162,905 |
181,999 |
-6.44% |
11.72% |
11,684 |
5,746 |
7,012 |
-50.82% |
22.04% |
2015 Performance Forecast of CSI300 Listed Companies
Industry:Electricity
Unit: mln yuan
| No. |
Stock Code |
Company Name |
Operating revenue |
Net Profit |
| 2013 |
2014 |
Forecast
in 2015 |
Actual growth rate
in 2014 |
Forecasted growth rate
in 2015 |
2013 |
2014 |
Forecast
in 2015 |
Actual growth rate
in 2014 |
Forecasted growth rate
in 2015 |
| 1 |
600011 |
HPI |
133,833 |
125,407 |
137,948 |
-6.30% |
10.00% |
10,520 |
10,546 |
13,572 |
0.24% |
28.70% |
| 2 |
601991 |
Datang Power |
75,227 |
70,194 |
64,579 |
-6.69% |
-8.00% |
3,527 |
1,798 |
1,535 |
-49.01% |
-14.65% |
| 3 |
600027 |
HDPI |
66,625 |
68,398 |
72,502 |
2.66% |
6.00% |
4,139 |
5,902 |
6,848 |
42.60% |
16.03% |
| 4 |
600795 |
GDPD |
66,307 |
61,475 |
65,163 |
-7.29% |
6.00% |
6,279 |
6,075 |
6,672 |
-3.26% |
9.84% |
| 5 |
600023 |
Zhejiang Energy Electric Power |
53,916 |
44,179 |
45,039 |
-18.06% |
1.95% |
5,757 |
5,964 |
6,285 |
3.60% |
5.38% |
| 6 |
600886 |
SDIC Power |
28,339 |
32,957 |
37,242 |
16.30% |
13.00% |
3,305 |
5,597 |
6,378 |
69.32% |
13.96% |
| 7 |
000539 |
GED |
30,831 |
29,047 |
26,072 |
-5.79% |
-10.24% |
3,086 |
3,004 |
2,654 |
-2.67% |
-11.65% |
| 8 |
600900 |
CYPC |
22,698 |
26,898 |
26,091 |
18.50% |
-3.00% |
9,071 |
11,830 |
12,576 |
30.42% |
6.31% |
| 9 |
600642 |
Shenergy |
25,745 |
25,407 |
28,710 |
-1.31% |
13.00% |
2,449 |
2,061 |
2,562 |
-15.83% |
24.28% |
| 10 |
600863 |
NMHD |
12,153 |
13,634 |
12,271 |
12.19% |
-10.00% |
1,376 |
1,363 |
922 |
-0.95% |
-32.36% |
| 11 |
600578 |
BJP |
10,071 |
12,964 |
11,667 |
28.73% |
-10.00% |
2,196 |
2,551 |
2,082 |
16.14% |
-18.38% |
| 12 |
000027 |
SHENZHEN ENERGY |
12,351 |
12,506 |
11,255 |
1.26% |
-10.00% |
1,453 |
2,034 |
1,884 |
39.99% |
-7.39% |
| 13 |
000883 |
HEGC |
11,119 |
7,293 |
7,803 |
-34.41% |
7.00% |
944 |
1,144 |
1,645 |
21.17% |
43.85% |
| 14 |
600674 |
SCTE |
1,148 |
1,103 |
1,158 |
-3.95% |
5.00% |
1,366 |
3,477 |
4,761 |
154.46% |
36.92% |
| Total |
550,362 |
531,461 |
547,500 |
-3.43% |
3.02% |
55,469 |
63,345 |
70,375 |
14.20% |
11.10% |
2015 Performance Forecast of CSI300 Listed Companies
Industry:Food
Unit: mln yuan
| No. |
Stock Code |
Company Name |
Operating revenue |
Net Profit |
| 2013 |
2014 |
Forecast
in 2015 |
Actual growth rate
in 2014 |
Forecasted growth rate
in 2015 |
2013 |
2014 |
Forecast
in 2015 |
Actual growth rate
in 2014 |
Forecasted growth rate
in 2015 |
| 1 |
600887 |
YILI |
47,779 |
54,436 |
62,602 |
13.93% |
15.00% |
3,187 |
4,144 |
5,621 |
30.03% |
35.63% |
| 2 |
000895 |
SHUANGHUI |
44,950 |
45,696 |
50,265 |
1.66% |
10.00% |
3,858 |
4,040 |
4,405 |
4.71% |
9.03% |
| 3 |
600597 |
BRIGHT DAIRY |
16,291 |
20,385 |
25,074 |
25.13% |
23.00% |
406 |
568 |
847 |
39.87% |
49.19% |
| 4 |
600873 |
MEIHUA BIO |
7,780 |
9,865 |
15,291 |
26.79% |
55.00% |
404 |
500 |
1,494 |
23.92% |
198.61% |
| 5 |
603288 |
HAI TIAN |
8,402 |
9,817 |
11,486 |
16.85% |
17.00% |
1,606 |
2,090 |
2,557 |
30.12% |
22.32% |
| 6 |
002570 |
beingmate |
6,117 |
5,049 |
5,503 |
-17.46% |
9.00% |
721 |
69 |
81 |
-90.45% |
18.23% |
| 7 |
300146 |
BY-HEALTH |
1,482 |
1,705 |
2,182 |
15.03% |
28.00% |
422 |
503 |
655 |
19.19% |
30.36% |
| Total |
132,802 |
146,953 |
172,403 |
10.66% |
17.32% |
10,604 |
11,914 |
15,660 |
12.35% |
31.44% |
2015 Performance Forecast of CSI300 Listed Companies
Industry:Department Stores
Unit: mln yuan
| No. |
Stock Code |
Company Name |
Operating revenue |
Net Profit |
| 2013 |
2014 |
Forecast
in 2015 |
Actual growth rate
in 2014 |
Forecasted growth rate
in 2015 |
2013 |
2014 |
Forecast
in 2015 |
Actual growth rate
in 2014 |
Forecasted growth rate
in 2015 |
| 1 |
002024 |
SUNING COMMERCE |
105,292 |
108,925 |
133,325 |
3.45% |
22.40% |
372 |
867 |
937 |
133.19% |
8.06% |
| 2 |
600827 |
SBGCL |
51,926 |
51,164 |
53,753 |
-1.47% |
5.06% |
1,036 |
1,046 |
1,191 |
1.02% |
13.85% |
| 3 |
601933 |
YONGHUI SUPERSTORES |
30,543 |
36,727 |
40,458 |
20.25% |
10.16% |
721 |
852 |
1,027 |
18.18% |
20.62% |
| 4 |
600415 |
YIWU CCC |
3,655 |
3,843 |
3,646 |
5.16% |
-5.14% |
707 |
409 |
549 |
-42.19% |
34.12% |
| 5 |
002344 |
CHN LEATHER MARKET |
2,933 |
2,439 |
2,040 |
-16.81% |
-16.36% |
1,039 |
936 |
818 |
-9.88% |
-12.61% |
| Total |
194,348 |
203,099 |
233,222 |
4.50% |
14.83% |
3,875 |
4,110 |
4,522 |
6.08% |
10.02% |
2015 Performance Forecast of CSI300 Listed Companies
Industry:Home Appliances
Unit: mln yuan
| No. |
Stock Code |
Company Name |
Operating revenue |
Net Profit |
| 2013 |
2014 |
Forecast
in 2015 |
Actual growth rate
in 2014 |
Forecasted growth rate
in 2015 |
2013 |
2014 |
Forecast
in 2015 |
Actual growth rate
in 2014 |
Forecasted growth rate
in 2015 |
| 1 |
000333 |
MIDEA GROUP |
121,265 |
142,311 |
158,221 |
17.36% |
11.18% |
5,317 |
10,502 |
12,110 |
97.50% |
15.30% |
| 2 |
000651 |
GREE |
120,043 |
140,005 |
142,806 |
16.63% |
2.00% |
10,871 |
14,155 |
16,676 |
30.21% |
17.81% |
| 3 |
000100 |
TCL |
85,504 |
101,297 |
110,555 |
18.47% |
9.14% |
2,109 |
3,183 |
3,324 |
50.93% |
4.43% |
| 4 |
600690 |
HAIER |
86,488 |
88,775 |
89,645 |
2.65% |
0.98% |
4,168 |
4,992 |
5,878 |
19.75% |
17.76% |
| 5 |
600839 |
CHANGHONG |
58,875 |
59,504 |
62,515 |
1.07% |
5.06% |
512 |
59 |
118 |
-88.52% |
99.93% |
| 6 |
600060 |
HXDQ |
28,480 |
29,007 |
31,067 |
1.85% |
7.10% |
1,583 |
1,400 |
1,553 |
-11.55% |
10.93% |
| Total |
500,655 |
560,899 |
594,809 |
12.03% |
6.05% |
24,561 |
34,291 |
39,659 |
39.62% |
15.65% |
2015 Performance Forecast of CSI300 Listed Companies (summary sheet)
2015/7/1 Wistrategy Consulting
 2015 profit growth of construction industry expected to decline
 Transportation industry to accelerate in 2015
 Insufficient demand herald a negative growth in the coal industry in 2015
 Major National Strategies Boost the Performance Rally of Machinery Industry
 Big Consumption Industry to Recover in 2015
 Electricity industry sees steady growth in 2015
 Banking industry profitability declines in consecutive five years
 Reconstruction of shanty towns boost growth in real estate industry in 2015
 Nonferrous Metals Industry turns loss to profit in 2015
 New energy & Internet bolster growth of automobile industry in 2015
 Iron & steel industry with high technology content in 2015
 Declining trend of China electronic information industry be curbed in 2015